Bitcoin Descending Triangle Hints At Third Downtrend Before Bear Market Finish
Bitcoin price has now set a handful of lower highs on the daily timeframe but has yet to make a lower low, confirming a downtrend. However, each subsequent lower high has now resulted in what appears to be a descending triangle pattern – a traditionally bearish pattern for the cryptocurrency. Will this triangle eventually break […]

Bitcoin price has now set a handful of lower highs on the daily timeframe but has yet to make a lower low, confirming a downtrend. However, each subsequent lower high has now resulted in what appears to be a descending triangle pattern – a traditionally bearish pattern for the cryptocurrency.
Will this triangle eventually break down also, prompting the first lower low and confirming a third stretch of downtrend for Bitcoin before its bear market is officially finished?
Lower Highs Form Descending Triangle, But Bears Have Yet To Break $10,000
Weeks ago at this point, Bitcoin price broke upward through resistance at $10,000 and has only briefly since traded below it. No daily candles have closed under the critical level that was only just freshly claimed.
Bulls defended $10,000 support seven days straight, only to have Bitcoin price knocked right back down to the low $10,000 range.
Each time bulls make another push higher, its rejected before a new local high can be set. With every subsequent lower high, a descending triangle pattern may be forming. These often bearish chart patterns, in the past, haven’t been very forgiving to the first-ever cryptocurrency.
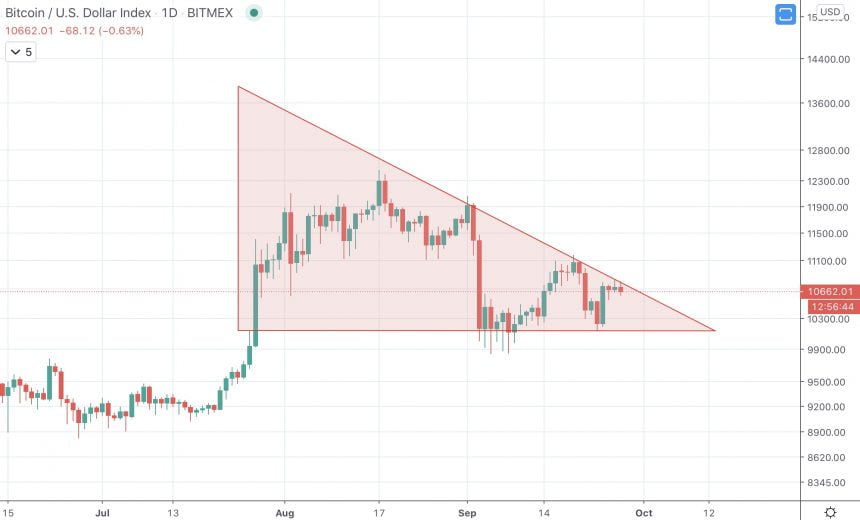
BTCUSD 1D Price Chart Descending Triangle | Source: TradingView
The current structure, however, isn’t too dangerous according to technical analysis. If the pattern confirms with a breakdown, Bitcoin price will have a short-term price target of roughly $8,250 – or an 18% decline.
Related Reading | Break of “Market Structure” Puts Bitcoin Uptrend On Thin Ice
What’s more damning for Bitcoin, however, is the fact that a series of lower highs, combined with a lower low, would suggest the cryptocurrency has entered yet another downtrend on daily timeframes.
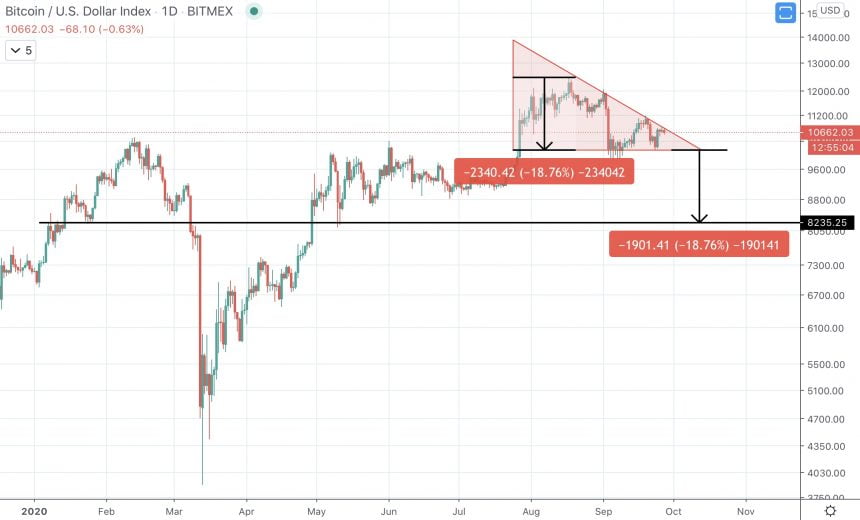
BTCUSD 1D Price Chart Descending Triangle Target | Source: TradingView
Bitcoin Bear Market Comeback Could Be Next If Formation Confirms Downtrend
Making matters worse for the leading cryptocurrency by market cap is that past price action shows that each descending triangle have led to extended downtrends in Bitcoin.
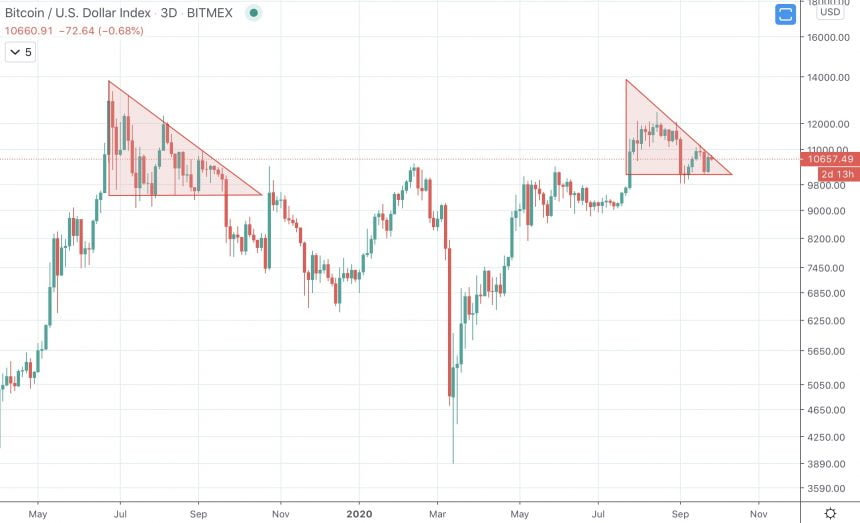
BTCUSD 3D Price Chart Descending Triangle Times Two | Source: TradingView
The most recent descending triangle took place after Bitcoin price ran headfirst into $13,800. Lower highs eventually led to a lower low, and a downtrend climaxing on Black Thursday this March.
The crypto market rebounded into the rest of the year, but the risk ahead has investors pausing. The coming election combined with the pandemic persisting, political protest spreading, and an economy a mess, profit-taking has prices consolidating.
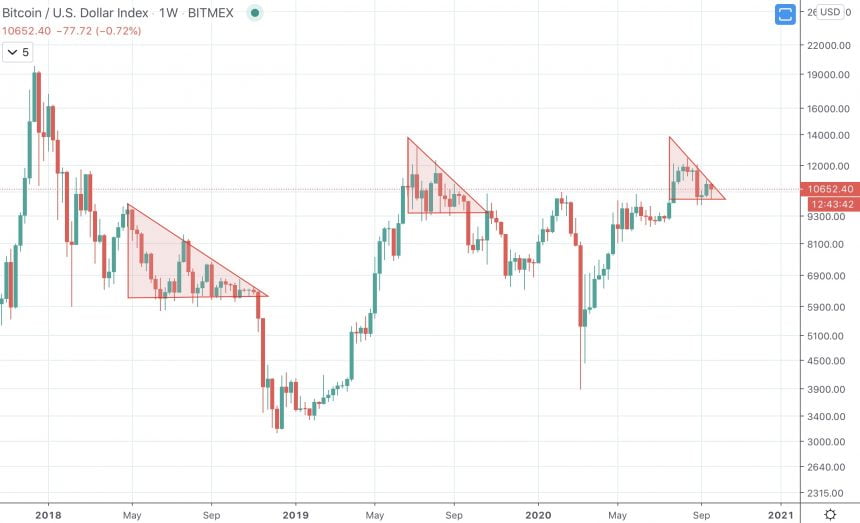
BTCUSD 3D Price Chart Descending Triangle Times Three | Source: TradingView
Before that top-indicating, reversal pattern, the previous descending triangle breaking down is what took the cryptocurrency to its current bear market bottom.
Related Reading | Bitcoin Fundamental Expert: “Clarity” Comes After “Rocky” Election Ends
This isn’t all bad for Bitcoin, however. The downside impact of each pattern is diminishing each time, suggesting there is less distribution each round of selling. Eventually, those who wanted to sell Bitcoin below $12,000 will have already done so, and upside momentum could finally take over.
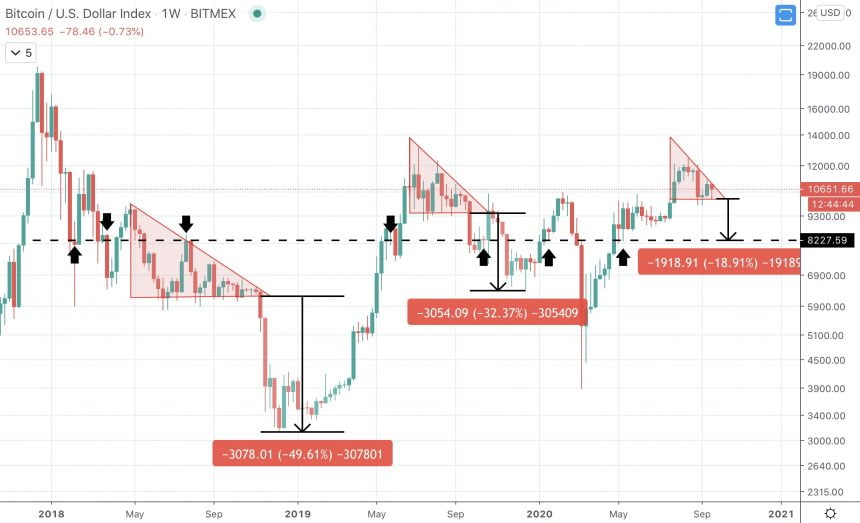
BTCUSD 3D Price Chart Descending Triangle Target Bear Market Point-Of-Control | Source: TradingView
In the last bear market, Bitcoin had three bottoms. Could the same happen again, starting with a breakdown of the descending triangle potentially forming on the daily?


