Beware: Bitcoin Price Action Mimics Market Maker Model
Bitcoin price just plunged once again from over $11,000 and is currently holding around $10,500. The support level could just be a quick pitstop before the selloff continues, according to the recent price action resembling the “market maker profile sell model.” If the cryptocurrency continues to follow the projected path this particular model predicts, Bitcoin […]

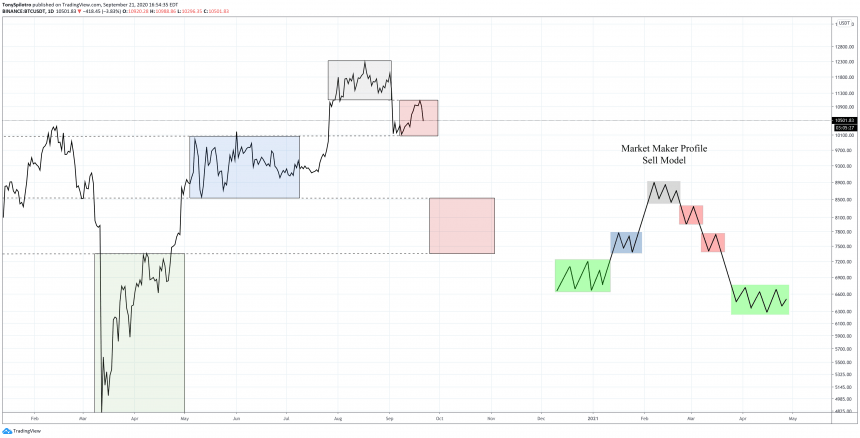
Bitcoin price just plunged once again from over $11,000 and is currently holding around $10,500. The support level could just be a quick pitstop before the selloff continues, according to the recent price action resembling the “market maker profile sell model.”
If the cryptocurrency continues to follow the projected path this particular model predicts, Bitcoin could fall to new local lows, or worse.
Bitcoin Market Maker Sell Model: Wyckoff Distribution By Another Name
When an asset falls to attractive prices, it is accumulated by smart money investors who take a positon ahead of a large price increase. This transition from accumulation phase to mark up often results in a strong climb to a higher level, where a pause takes place before another rise.
This is exactly what happened when Bitcoin touches its current bear market bottom at $3,200 and then rocketed to $14,000 in a matter of months.
Related Reading | Bitcoin “Distribution” Could Lead To Another Arm And A Leg Down
The same sort of theory is true in inverse for Bitcoin or any other assets. According to Wyckoff distribution models – which some analysts claim matches the cryptocurrency’s recent top price action – after distribution, comes mark down, then the cycle repeats.
That type of sell model very closely matches recent Bitcoin trading action, however, another more ominous looking sell model has also surfaced that suggests new lows could be set.

BTCUSD Daily Line Chart Market Maker Sell Model Example Zoomed In | Source: TradingView
Does The Crypto Market Mimicking This Structure Suggest New Lows Are Next?
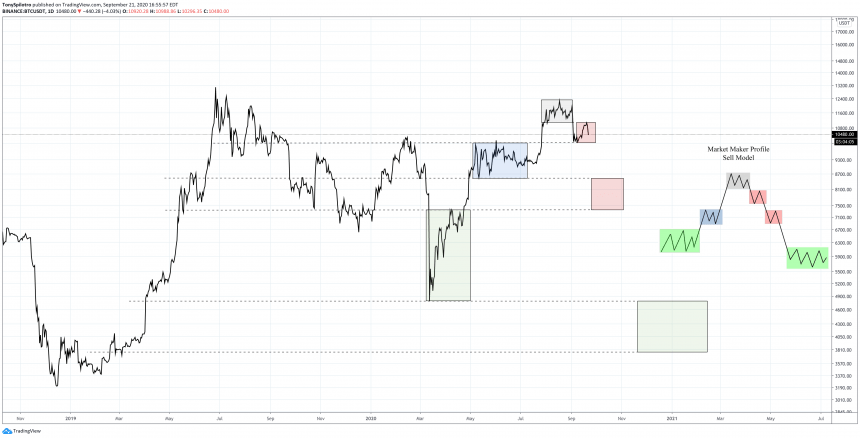
In the market maker profile sell model, there is risk of another low, depicted in the comparison chart below. The same model from above when zoomed out matches areas of prevous interest on the asset’s daily price chart.
The next potential level, if the model continues to follow, would be around the $8,500 to $7,400 range, where Bitcoin bounced from for the record-setting October 2019 China pump.

BTCUSD Daily Line Chart Market Maker Sell Model Example Zoomed Out | Source: TradingView
In the market maker sell model, it predicts a deeper drop than what Bitcoin experienced on Black Thursday, potentially back to support where the asset broke out from its bear market bottom for yet another retest.
Related Reading | Financial Advisory Group: Bitcoin Would Be 40% More Valuable Without Manipulation
If Bitcoin’s bottom holds yet again, for a third time, it could finally be considered unbreakable. During Bitcoin’s last bull market, a triple bottom acted as the grand finale before the greatest bull run ever seen.
But if the bottom doesn’t hold, there could be another box below the green that gets filled in with some price action, and that’s not what any crypto investors want to see.


