“Weak Hands” Have Been Shaken Out On The Bitcoin Crash To $10,000
Bitcoin price this past week collapsed from the 2020 high of over $12,400 to under $10,000. More than seven distinct drops to below $10,000 have been bought up already. During each plunge down, however, some of the weakest hands in the crypto market may have been shaken out, according to one uncommon metric. If that’s […]
Bitcoin price this past week collapsed from the 2020 high of over $12,400 to under $10,000. More than seven distinct drops to below $10,000 have been bought up already.
During each plunge down, however, some of the weakest hands in the crypto market may have been shaken out, according to one uncommon metric. If that’s the case, and bulls can hold support, the last chance to buy the dip before new highs may already be upon us.
Weak Hands: Could The Latest Bitcoin Crash Be A Shakeout Before The Bull Run?
The term HODL, or hold on for dear life, was coined – no pun intended – to help crypto investors cope with the extreme price swings the asset class is known for.
Rather than risk being shaken out, or trying to trade BTC for a profit with mixed results, long-time crypto investors advocate simply holding strong for the long-term.
Since the Black Thursday market collapse, more and more investors had been doing just that, taking their BTC off of exchanges and moving them into cold storage or other means.
Related Reading | Don’t Panic: Crypto Market Collapse Was “Profit-Taking” and “Rebalancing”
Various metrics exist that pay attention to how much BTC is stored where, along with when and at what price it was purchased at. One such metric, the Spent Output Profit Ratio measures overall market profit and loss, and “represents the profit ratio of coins moved on-chain, measured through the variation between purchase price and sale price.”
Essentially, this metric tracks if any Bitcoin’s moved are doing so at a loss or gain. The SOPR indicator on glassnode, fell below Bitcoin price itself for the first time since April. This could indicate that “weak hands” were shaken out at a “small” loss, according to data scientist Rafael Schultze-Kraft.
1/ #Bitcoin SOPR (entity-adjusted) dipped below 1 for the first time since April.
This means bitcoins moved on-chain at a (small) loss, potentially shaking out some weak hands.
Imo it is very crucial to hold this level here so a bearish trend reversal doesn't get confirmed. pic.twitter.com/1i1uA9i1Yn
— Rafael Schultze-Kraft (@n3ocortex) September 7, 2020
Here’s Why Holding Strong Here Could Lead To A New Crypto Market Uptrend
While the selloff most certainly brought a return to fear across the crypto space, the price action could be a bullish retest of resistance turned support. SOPR holding at the same level as price action itself could confirm a trend change in favor of a bull market.
Related Reading | Bitcoin Crossroads Made Clear By Two Remaining Lines in The Sand
This would suggest that the most recent crash was nothing more than a shakeout. Other analysts agree and say that the correction was healthy, and nothing more than regular profit-taking and portfolio rebalancing after such substantial returns in 2020.
If Bitcoin can hold, fundamental metrics like the SOPR and even technical analysis indicates a new, long-term uptrend taking shape.
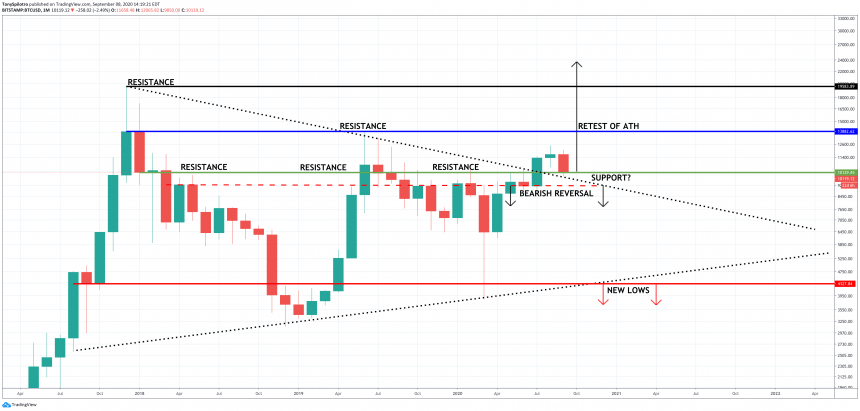
BTCUSD Monthly Bullish Market Structure and Levels To Watch | Source: TradingView
Monthly Bitcoin price charts show that the recent shakeout is actually a bullish retest in progress. Not only is the cryptocurrency retesting horizontal resistance at $10,000 as support, but it’s also working on confirming the bear market downtrend line as support as well.
A breakdown and close below $9,250 could cause a full bearish reversal and a fall towards the bottom triangle trendline. This would also suggest that the breakout above the triangle trendline, was a false breakout and things could get dangerous.
False breakouts often lead to a breakdown in the other direction. A fall to below $4,500 could be the final nail in the crypto market’s coffin. However, with stats like the SOPR and dozens of technical indicators and chart formations so bullish, more signs point to a shakeout of weak hands, than smart sellers catching the top.