TA: Bitcoin Topside Bias Vulnerable If It Continues To Struggle Below $11.5K
Bitcoin price is consolidating in a range below the $11,500 resistance against the US Dollar. BTC could start a substantial decline if it breaks the $11,230 support zone. Bitcoin is struggling to gain traction above the $11,500 and $11,520 resistance levels. The price is currently trading below $10,400 support and the 100 hourly simple moving […]

Bitcoin price is consolidating in a range below the $11,500 resistance against the US Dollar. BTC could start a substantial decline if it breaks the $11,230 support zone.
- Bitcoin is struggling to gain traction above the $11,500 and $11,520 resistance levels.
- The price is currently trading below $10,400 support and the 100 hourly simple moving average.
- There is a short-term contracting triangle forming with resistance near $11,480 on the hourly chart of the BTC/USD pair (data feed from Kraken).
- The pair could start a strong downside correction if it breaks the $11,230 and $11,200 support levels.
Bitcoin Price Consolidating Gains
In the past three sessions, there were mostly range moves in bitcoin price below the $11,560 and $11,500 resistance levels. It seems like BTC made two attempts to surpass the $11,560 level, but it failed to gain bullish momentum.
The last swing high was near $11,560 before the price declined below $11,400. It traded as low as $11,302 and it is currently correcting higher. There was a break above the $11,350 level, plus the 23.6% Fib retracement level of the recent decline from the $11,560 high to $11,302 low.
However, bitcoin is still trading below $10,400 support and the 100 hourly simple moving average. An immediate resistance is near the $11,430 level since it is close to the 50% Fib retracement level of the recent decline from the $11,560 high to $11,302 low.
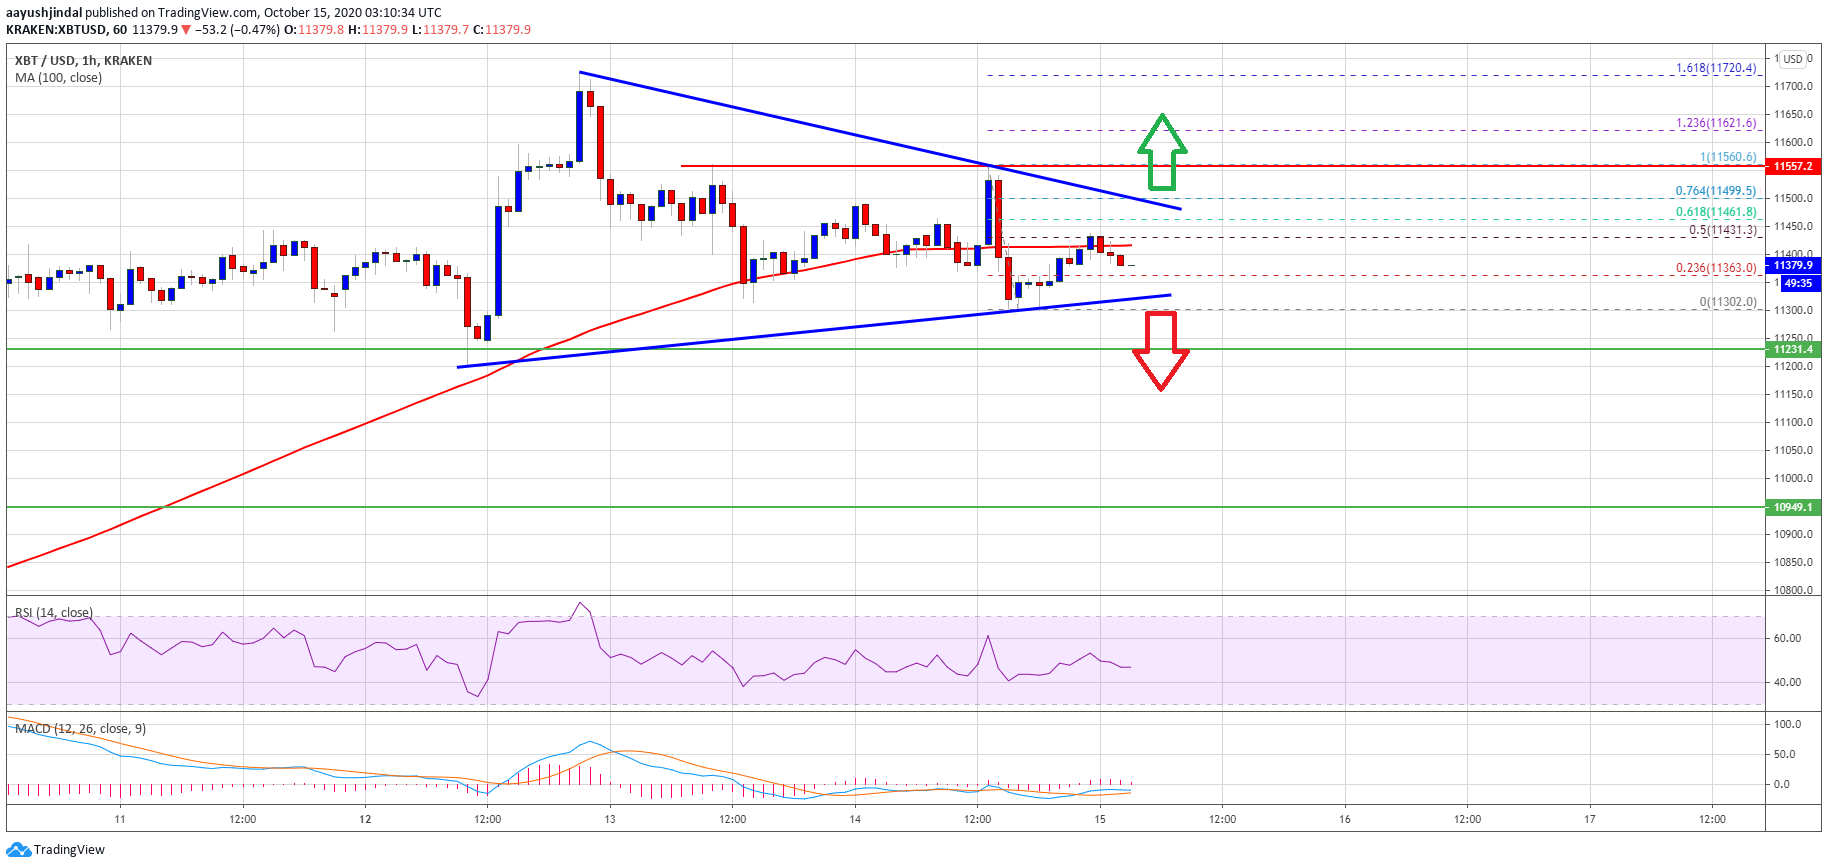
Source: BTCUSD on TradingView.com
There is also a short-term contracting triangle forming with resistance near $11,480 on the hourly chart of the BTC/USD pair. To start a strong increase, bitcoin price needs to gain momentum above the $11,500 and $11,560 resistance levels. The next stop could be near $11,700, above which there are chances of a push towards the $12,000 level.
Downside Break in BTC?
If bitcoin fails to surpass the $11,500 and $11,560 resistance levels, there is a risk of a bearish break. The triangle support is near the $11,320 level.
The main support is near the $11,230 and $11,200 levels, below which the bears are likely to aim a larger downside correction. The next immediate support could be $11,000, below which the price might slide towards $10,500.
Technical indicators:
Hourly MACD – The MACD is about to move into the bearish zone.
Hourly RSI (Relative Strength Index) – The RSI for BTC/USD is just below the 50 level, with a flat bias.
Major Support Levels – $11,320, followed by $11,230.
Major Resistance Levels – $11,480, $11,500 and $11,560.