Ethereum Price Forecast: ETH On The Cusp Of Breakdown To $300
Ethereum has been rejected at the 100 SMA; the path of least resistance is downwards. ETH/USD is dealing with the absence of substantial support as highlighted by on-chain analysis. Ethereum is struggling to stay above the initial support at $340. Its immediate upside is capped by the 100-day Simple Moving Average. Recently support was established The post Ethereum Price Forecast: ETH On The Cusp Of Breakdown To $300 appeared first on Coingape.

- Ethereum has been rejected at the 100 SMA; the path of least resistance is downwards.
- ETH/USD is dealing with the absence of substantial support as highlighted by on-chain analysis.
Ethereum is struggling to stay above the initial support at $340. Its immediate upside is capped by the 100-day Simple Moving Average. Recently support was established at $330, which gave way for price action above $350. However, the next key resistance at the 50% Fibonacci level of the last drop from $489 to a swing low of $229 remained untested.
The uncertainty in the price movement is not unique to Ethereum, as Bitcoin is also sluggish. The decentralized finance (DeFi) sector has bled a lot during this retracement period. Some tokens in DeFi have retreated massively with some correcting by more than 20%.
Looking at Ethereum, the path of least resistance remains downwards. The longer the price stays under the 100-day SMA, the stronger the sellers become. On the other hand, exhaustion continues to engulf the bullish camp.
The bearish outlook is emphasized by the gradually sloping Relative Strength Index (RSI). If the trend strength indicator closes in on the oversold, the smart contract token would be on the way to retest support targets at $330 and $320.
ETH/USD daily chart
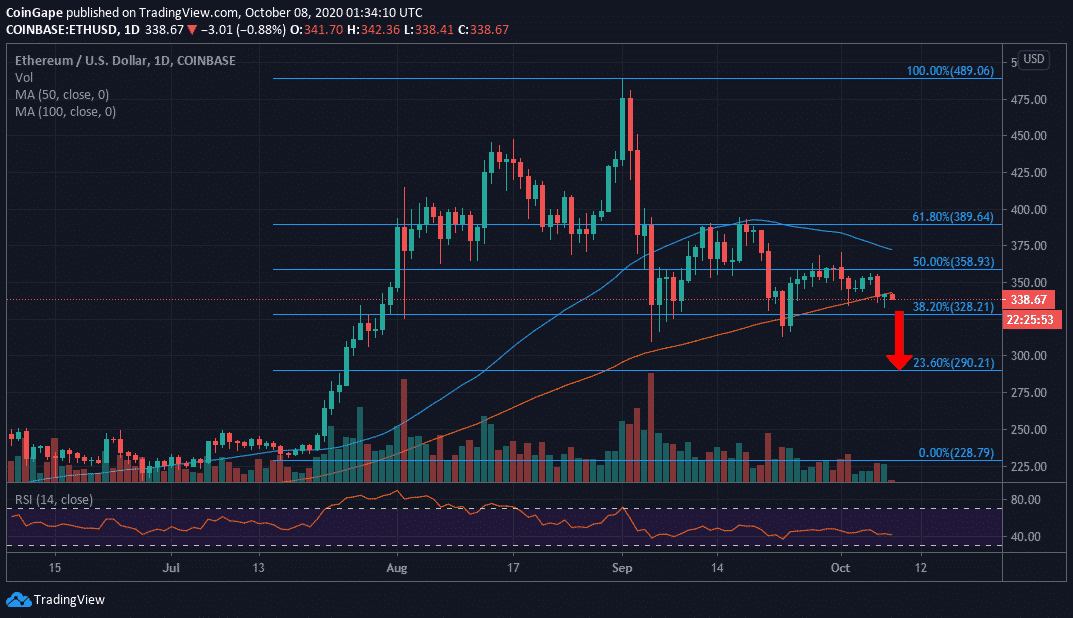
At the moment, low trading volume and the lack of volatility suggests that downward price actions will not be rapid in the near term. On-chain data by IntoTheBlock reveals the absence of a strong buyer congestion zones. Therefore, Ethereum has a relatively clear path to explore levels towards $300.
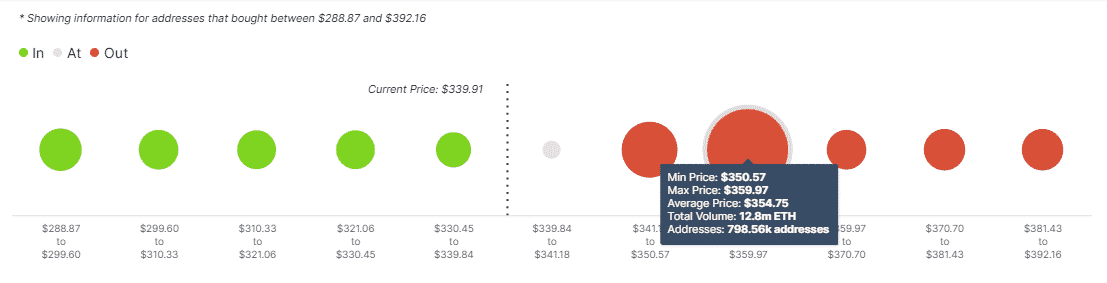
Meanwhile, the most robust support is highlighted between $239 and $300. Here, roughly 925,000 addresses previously purchased Ethereum in this range. On the flip side, a major hurdle runs from $351 to $360. Previously, nearly 799,000 addresses bought approximately 13 million Ethereum.
Ethereum Intraday Levels
Spot rate: $338
Relative change: -3
Percentage change: -0.9
Trend: Bearish
Volatility: Low
The post Ethereum Price Forecast: ETH On The Cusp Of Breakdown To $300 appeared first on Coingape.


![Uniswap Token [UNI] Crashes in Response to BTC and ETH Options Expiring](../wp-content/uploads/2020/09/21202023/aircraft-2497005_1920.jpg)