Ethereum Key Indicators Suggest A Strong Rally if it Clears $355
Ethereum is trading near a major resistance zone at $355 against the US Dollar. ETH price is likely to accelerate higher once there is a proper close above $355. Ethereum is attempting a major upside break above the key $355 resistance zone. The price must stay above the 100 hourly simple moving average and $350 […]

Ethereum is trading near a major resistance zone at $355 against the US Dollar. ETH price is likely to accelerate higher once there is a proper close above $355.
- Ethereum is attempting a major upside break above the key $355 resistance zone.
- The price must stay above the 100 hourly simple moving average and $350 for a possible bullish break.
- There is a key contracting triangle forming with resistance near $355 on the hourly chart of ETH/USD (data feed via Kraken).
- The pair could also decline heavily below $350 if it continues to struggle near $355.
Ethereum Price is Testing Crucial Resistance
Ethereum started a fresh recovery wave from the $335 support level. ETH price settled above the $340 pivot level and it even climbed above the 100 hourly simple moving average.
The bulls were able to clear the $350 resistance, but they are facing an uphill task near the $355 level. Ether price has already made more than two attempts to clear the $355 resistance, but it failed to gain bullish momentum.
The price is currently stuck near the $355 level. The recent high was formed near $355 before there was a minor downside correction. The price spiked below the 23.6% Fib retracement level of the upward move from the $345 swing low to $355 high.
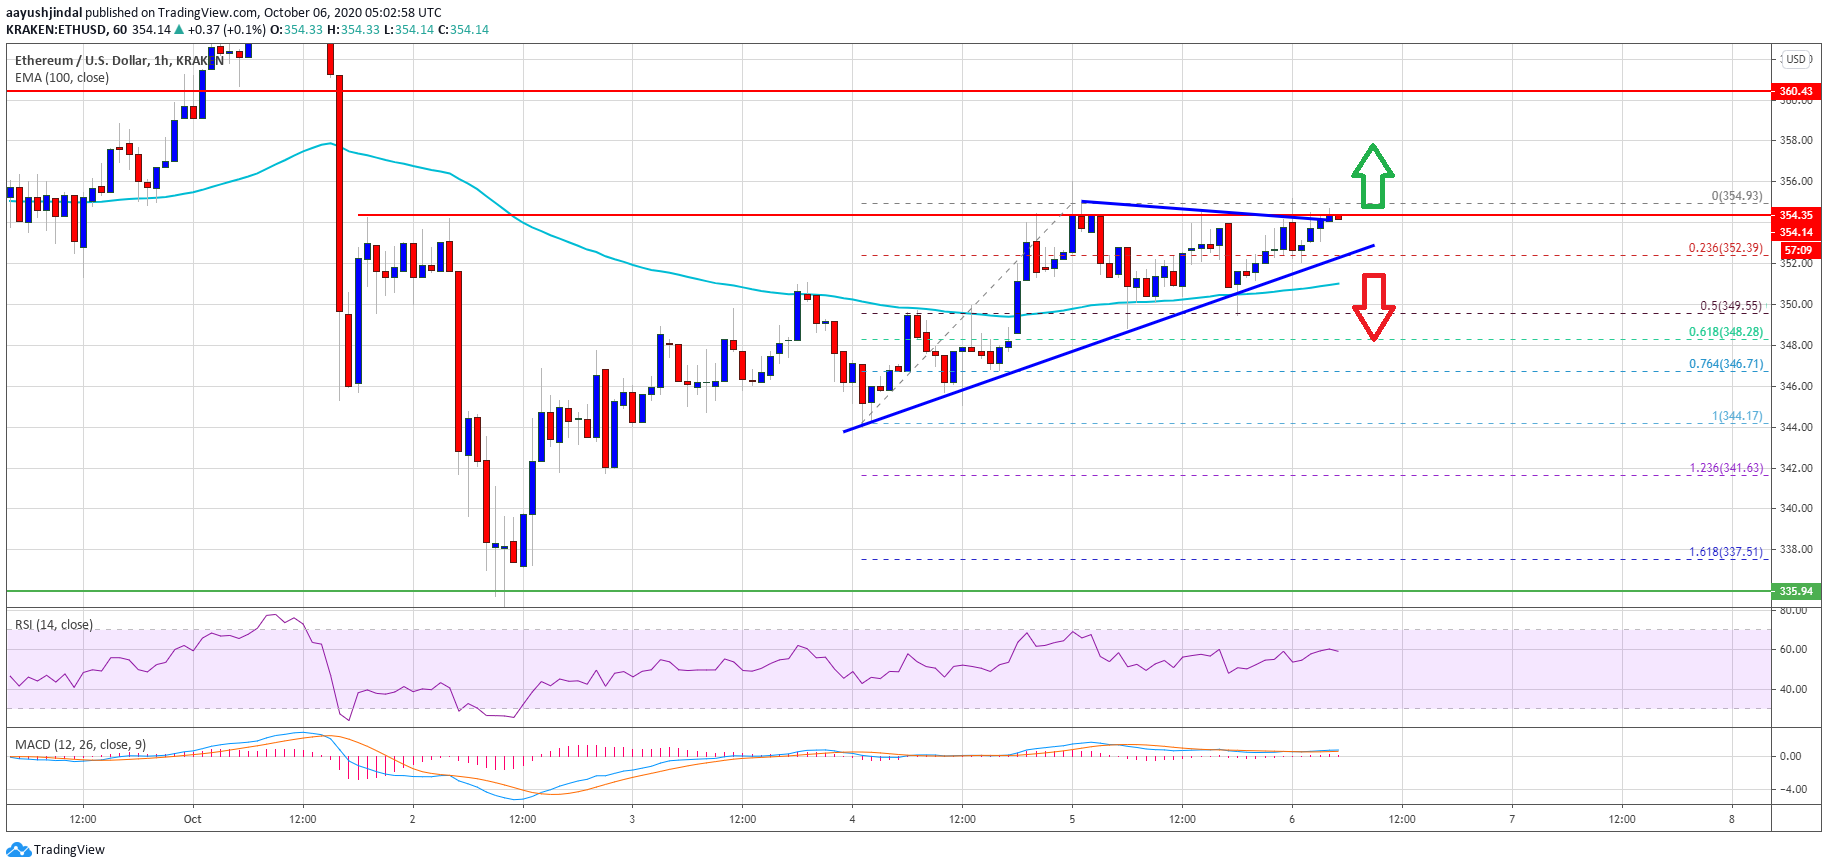
Ethereum price is testing $355. Source: TradingView.com
However, ether remained well bid above the $350 support and the 100 hourly SMA. The 50% Fib retracement level of the upward move from the $345 swing low to $355 high also acted as a support.
It seems like there is a key contracting triangle forming with resistance near $355 on the hourly chart of ETH/USD. If there is an upside break and close above $355, the price is likely to rise sharply. The next key resistance is near the $360 level, above which the price might surge towards $370.
Downside Break in ETH?
If Ethereum fails to clear the $355 resistance, there are chances of another bearish wave. An initial support on the downside is near the triangle trend line at $352.
The main support is forming near the 100 hourly SMA and the $350 level. A clear break below the $350 support level might negate the chances of a possible upward move towards $370 in the next 2-3 days.
Technical Indicators
Hourly MACD – The MACD for ETH/USD is struggling to gain pace in the bullish zone.
Hourly RSI – The RSI for ETH/USD is currently above the 50 level, with a bearish angle.
Major Support Level – $350
Major Resistance Level – $355