Bitcoin Price Prediction: BTC Prepares For A Major Liftoff To New Yearly Highs
Bitcoin stalls at $11,400 after rejection from $11,800; support is envisaged at $11,250. On-chain data shows whales constantly accumulating BTC; investors anticipate price action to new yearly highs. Bitcoin recently sliced through a symmetrical triangle pattern presented on the daily chart. The pattern has been discussed severally in our technical analyses. BTC closed in on The post Bitcoin Price Prediction: BTC Prepares For A Major Liftoff To New Yearly Highs appeared first on Coingape.

- Bitcoin stalls at $11,400 after rejection from $11,800; support is envisaged at $11,250.
- On-chain data shows whales constantly accumulating BTC; investors anticipate price action to new yearly highs.
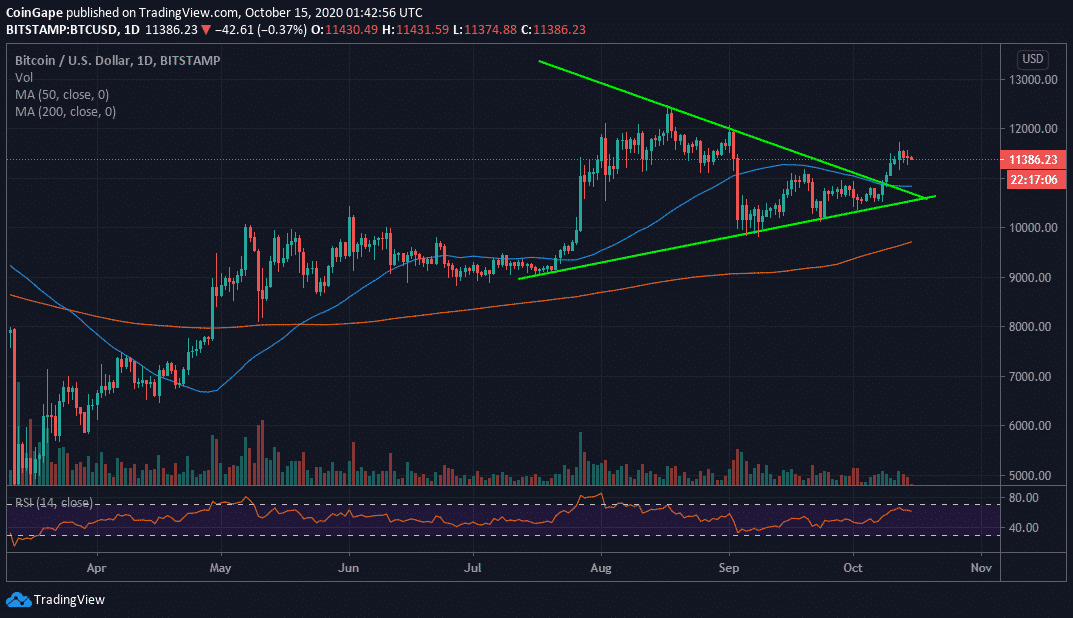
Bitcoin recently sliced through a symmetrical triangle pattern presented on the daily chart. The pattern has been discussed severally in our technical analyses. BTC closed in on the psychological resistance at $12,000 but lost momentum within a whisker of $11,800. A reversal ensued, sending Bitcoin back to support at $11,250. Meanwhile, the flagship cryptocurrency has sluggish in movement, remaining pivotal at $11,400.
According to Glassnode, a leading on-chain data analysis platform, whales have been on a constant buying spree for months. For instance, “2.6M $BTC (14% of supply) are currently held in accumulation addresses.” Note that accumulation addresses refer to those “addresses that have at least two incoming transactions and have never spent BTC.”
#Bitcoin accumulation has been on a constant upwards trend for months.
2.6M $BTC (14% of supply) are currently held in accumulation addresses.
Accumulation addresses are defined as addresses that have at least 2 incoming txs and have never spent BTC.https://t.co/VEt4a503ae pic.twitter.com/QhGqmxpv2S
— glassnode (@glassnode) October 14, 2020
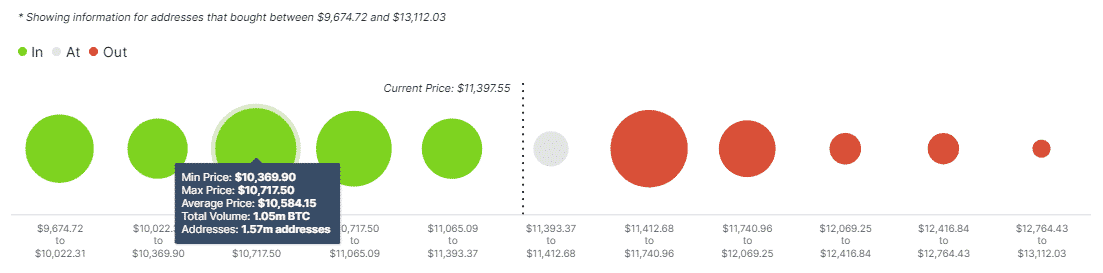
IntoTheBlock’s IOMAP model reveals the absence of a significant supply area that could prevent Bitcoin from soaring to yearly highs. However, the resistance between $11,413 and $11,740 must come down for this bullish narrative to be validated. Previously, nearly 1.5 million addresses purchased almost 923,000 BTC in the range.
On the downside, Bitcoin appears to be well protected due to the clusters of support zones offering immense support. It is doubtful that Bitcoin will spiral to $9,000 in the near term. The most robust anchor zone lies between $10,370 and $10,718, according to the model.
Bitcoin IOMAP chart
For now, short term technical analysis shows the possibility of retracement, preferably to $11,250 support before the bulls stage another breakout. The 50-day Simple Moving Average is in line to offer support above $10,800 if losses extended a bit lower. On the upside, price action is required above $11,600 and $11,800 for BTC to align with the trajectory to new yearly highs properly.
BTC/USD daily chart
BTC Intraday Levels
Spot rate: $11,380
Relative change: -45
Percentage change: -0.4
Trend: Bearish
Volatility: Low
The post Bitcoin Price Prediction: BTC Prepares For A Major Liftoff To New Yearly Highs appeared first on Coingape.


![Crypto Exchange Binance Lists DeFi Token Cream Finance [CREAM], Faces Backlash](../wp-content/uploads/2020/09/16224459/Binance-CREAM.jpg)