Bitcoin Price Prediction: BTC Could Suffer Another Rejection At $10,000
Bitcoin breaks out of a symmetrical triangle pattern, closing in on the critical $11,000. BTC has a relatively clear path to $11,500 as long as buyers can pull above the short term hurdle at $11,000. The flagship cryptocurrency broke out of a symmetrical triangle discussed multiple times this week. The 4-hour timeframe chart has seen The post Bitcoin Price Prediction: BTC Could Suffer Another Rejection At $10,000 appeared first on Coingape.

- Bitcoin breaks out of a symmetrical triangle pattern, closing in on the critical $11,000.
- BTC has a relatively clear path to $11,500 as long as buyers can pull above the short term hurdle at $11,000.
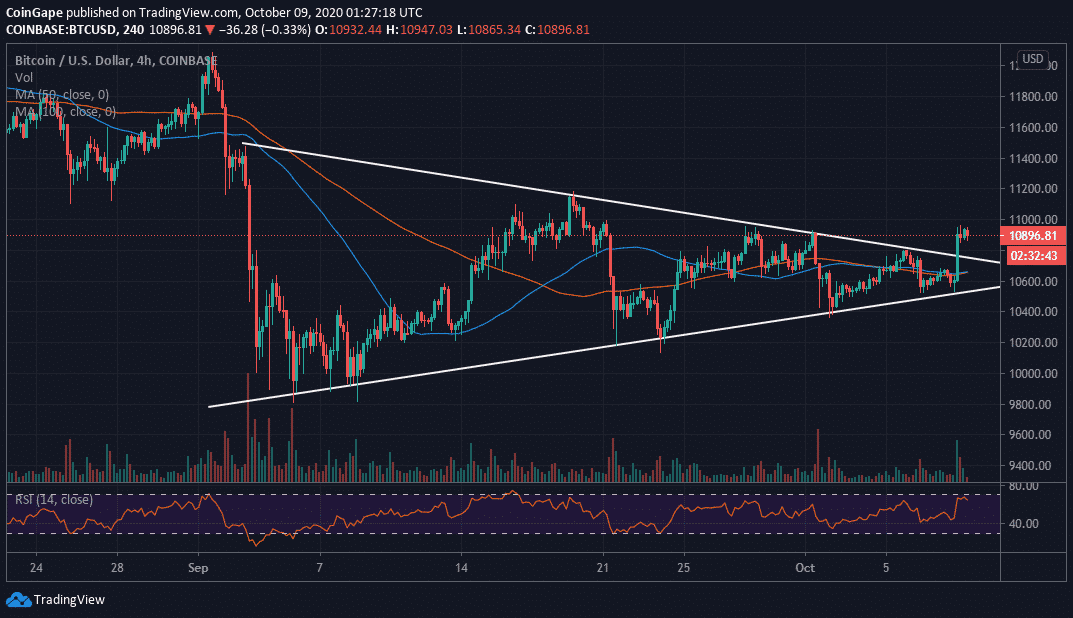
The flagship cryptocurrency broke out of a symmetrical triangle discussed multiple times this week. The 4-hour timeframe chart has seen Bitcoin print an engulfing candlestick, which culminated on a short-lived rally towards $11,000. The momentum appears to have built on the support at $10,600. Buyers cemented their position in the market by stepping above the confluence formed by the 50 Simple Moving Average and the 100 SMA.
Bitcoin exchanged hands within a whisker of $11,000 but buyers lost steam, leaving the critical level unconquered. Meanwhile, BTC is teetering at $10,900 amid a gradually building bearish grip. It is essential that the hurdle at $11,000 comes down to give bulls the ultimate push towards the psychological $12,000 level.
The Relative Strength Index (RSI) closed in on the overbought region but is pointing downwards at the momentum, illustrating the bears’ return. The volume is quite low, in a way, limiting price action. Therefore, consolidation is likely to take precedence as the weekend is ushered in. Initial support is highlighted at $10,800 but confluence formed by the 50 SMA and 100 SMA will absorb some of the selling pressure in case of a reversal. Other key levels to keep in mind include $10,600, $10,400 and the range between $10,200 and $10,000.
BTC/USD 4-hour chart
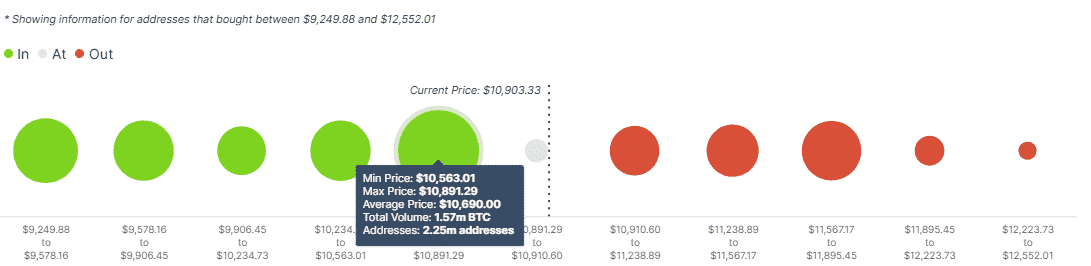
On-chain analysis using IntoTheBlock’s IOMAP model reveals reducing resistance towards the coveted $12,000 level. However, Bitcoin bulls must be ready to deal with the seller congestion between $11,567 and $11,895. Here, roughly, 960,000 addresses purchased nearly 667,000 BTC. On the downside, strong support runs from $10,563 to $10,891. Here, nearly 2.3 million addresses previously bought approximately 1.6 million BTC.
Bitcoin IOMAP chart
Bitcoin Intraday Levels
Spot rate: $10,900
Relative change: -33
Percentage change: -0.30
Trend: Short term bearish bias
Volatility: Low
The post Bitcoin Price Prediction: BTC Could Suffer Another Rejection At $10,000 appeared first on Coingape.