Bitcoin Price Analysis: BTC/USD Hunting For Explosive Breakout, Is $11,200 The Rendezvous?
Bitcoin price recovers slightly from a setback to $10,250 support; more upside expected in the near term. If Bitcoin flips the 50 SMA into support; a symmetrical triangle breakout could propel it to $11,200. Bitcoin price continues to trade in consolidation between the support at $10,000 and the resistance at $10,400. Following the initial breakdown


- Bitcoin price recovers slightly from a setback to $10,250 support; more upside expected in the near term.
- If Bitcoin flips the 50 SMA into support; a symmetrical triangle breakout could propel it to $11,200.
Bitcoin price continues to trade in consolidation between the support at $10,000 and the resistance at $10,400. Following the initial breakdown under $10,000, the flagship cryptocurrency has explored lows at $10,400. However, recovery has only made it above $10,400 ones while the resistance at $10,500 has never been broken.
On Thursday, Bitcoin came close enough to break the resistance at $10,400 but the seller congestion gave the bulls a snob, leaving room for growth. A retreat then followed with the bellwether cryptocurrency conforming support at $10,250.
At the moment, a shallow recovery has pulled Bitcoin above $10,300. BTC is trading at $10,330 while the bulls work hard to break the seller congestion at the 50 Simple Moving Average (SMA). If Bitcoin can manage to flip the 50 SMA into support, there is a big chance it can extend the move beyond the symmetrical triangle. A breakout from this pattern would most likely catapult BTC to highs above $10,800.
Read also: Bitcoin Technical Analysis: BTC Blasts Through Triangle Resistance, All Eyes On $10,800
BTC/USD 4-hour chart
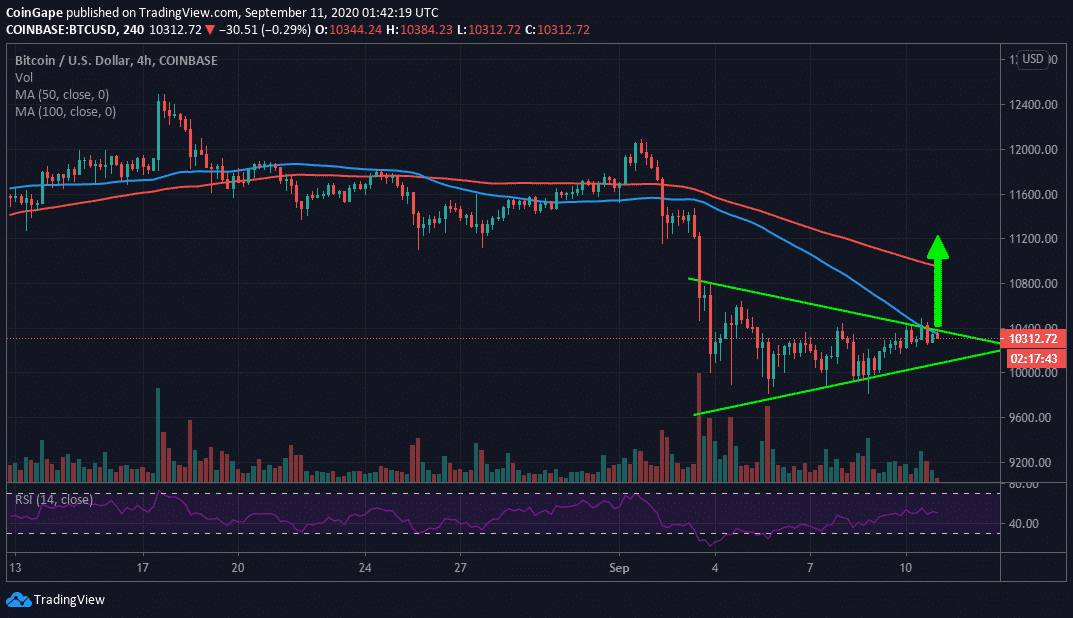
More resistance is envisaged at the 100 SMA currently holding the ground at $10,951. Again if this level is turned into support, the next resistance target would be $10,200 (an area that functioned as support in August),
Meanwhile, the Relative Strength Index (RSI) gradual upward movement illustrates that bulls are slowly taking back control of the price. Of course, setbacks are expected but as long as Bitcoin trades higher highs and higher lows, the uptrend would remain intact.
Bitcoin Intraday Levels
Spot rate: $10,330
Relative change: -9.97
Percentage change: -0.10%
Trend: Short term bearish bias
Volatility: Low
Read more: Bitcoin Price Prediction: BTC Holds In A Range, Is It Time To Buy The Dip?


![Despite Minor Sell-Offs, Bitcoin [BTC] Inches Closer to $14K, What’s Next?](../wp-content/uploads/2020/10/12120443/bitcoinprice.jpg)